

Investing in the U.S. stock market or running a business in the United States can be daunting for beginners. With thousands of publicly traded companies, fluctuating stock prices, and constant economic news, it’s easy to feel overwhelmed.
Understanding market analysis for beginners USA is the first step toward making informed decisions, reducing risk, and finding profitable opportunities. This guide explains everything from the basics of market analysis to tools, strategies, and practical tips for beginners.
1. What Is Market Analysis?
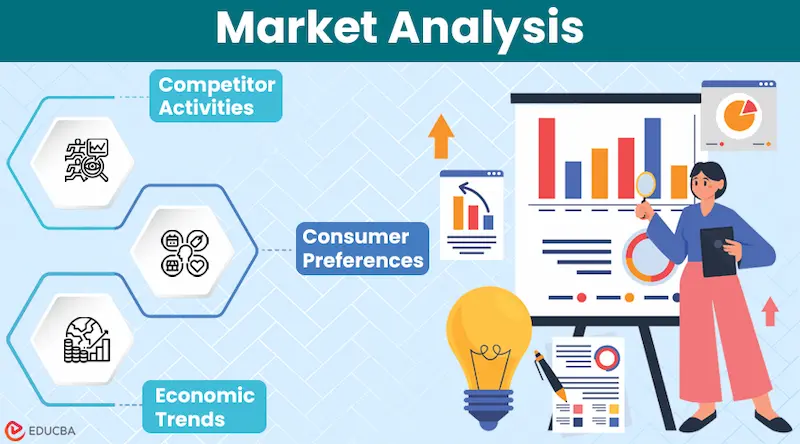
Market analysis is the systematic study of financial markets to understand trends, evaluate opportunities, and make informed investment or business decisions. In the U.S., market analysis often focuses on:
- Stock markets: NYSE, Nasdaq, AMEX
- Commodities: Gold, oil, agricultural products
- Bonds and ETFs: Government and corporate debt instruments
- Cryptocurrency and alternative assets
By analyzing these markets, beginners can predict trends, identify undervalued opportunities, and make decisions based on data rather than guesswork.
2. Why Market Analysis Is Important for Beginners
For newcomers, the U.S. financial market can seem unpredictable. Market analysis provides the framework to:
- Understand market trends: Recognize patterns in stock or sector performance
- Reduce risks: Avoid impulsive decisions based on rumors
- Identify opportunities: Spot growth stocks or emerging industries early
- Plan investments strategically: Allocate resources according to informed predictions
Learning to analyze the market builds confidence and provides a solid foundation for long-term financial success.
3. Types of Market Analysis
There are two primary types of market analysis beginners should understand:
A. Fundamental Analysis
Fundamental analysis examines the intrinsic value of a company or asset. Beginners focus on:
- Financial statements: Revenue, profit margins, debt levels
- Earnings reports: Quarterly and annual performance
- Market share and industry position
- Macroeconomic indicators: GDP growth, unemployment, inflation, interest rates
Example: Apple’s consistent revenue growth, strong product pipeline, and global market presence make it attractive according to fundamental analysis.
B. Technical Analysis
Technical analysis studies historical price movements to predict future trends. It relies on charts and indicators rather than company fundamentals. Key concepts include:
- Price charts: Line charts, bar charts, and candlestick charts
- Support and resistance levels: Identify price points where a stock tends to reverse direction
- Moving averages: Track the average price over time (50-day, 200-day MA)
- Momentum indicators: RSI, MACD, Bollinger Bands
- Volume analysis: Determine the strength of trends based on trading volume
Technical analysis is especially useful for short-term trading and spotting entry and exit points.
You may also like it:
Congress Law Changes Today: Key Updates & Impacts
Police Investigation News USA | Latest Crime & Case Updates
Popular Health Habits in USA Daily Wellness Guide 2025 Trend
Latest US Economic Predictions: 2025 Growth & Market Outlook
4. Understanding Market Trends
Beginners in the USA should recognize three main market trends:
- Bull Market: Prices rise over time, reflecting optimism and economic growth
- Bear Market: Prices decline, indicating pessimism and possible economic slowdown
- Sideways Market: Prices move within a narrow range, showing market indecision
Recognizing trends allows beginners to adjust their strategies—whether holding for long-term growth or trading short-term opportunities.
5. How to Analyze U.S. Markets Step by Step
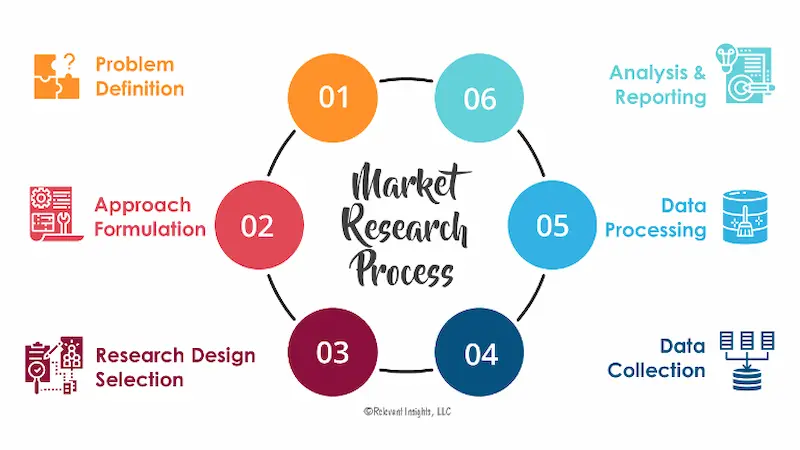
Here’s a beginner-friendly approach to analyzing the U.S. market:
- Start with major indexes: Track S&P 500, Dow Jones, Nasdaq
- Check market news: Follow CNBC, Bloomberg, MarketWatch
- Select a few sectors: Focus on technology, healthcare, energy, or consumer goods
- Use fundamental analysis: Evaluate company financials and growth prospects
- Use technical analysis: Identify trends, support/resistance, and momentum
- Compare peers: Look at similar companies to gauge performance
- Track market sentiment: Follow investor news, social media trends, and trading volumes
6. Key Tools for Beginners in the USA
To perform effective market analysis, beginners can use:
- Financial news websites: CNBC, Bloomberg, Yahoo Finance
- Trading platforms: Robinhood, TD Ameritrade, E*TRADE
- Charting tools: TradingView, StockCharts, Finviz
- Economic calendars: Track earnings, Fed announcements, and employment reports
- Investment research reports: Morningstar, Zacks, or company SEC filings
These tools help beginners gather data, monitor trends, and make informed decisions.
7. Tips for Beginners
- Start small: Begin with a small portfolio or a paper trading account
- Diversify: Don’t put all money into one stock or sector
- Focus on learning: Treat mistakes as learning opportunities
- Set clear goals: Define short-term and long-term investment objectives
- Stay updated: Monitor economic data, corporate announcements, and market trends
- Keep records: Maintain a trading journal to track decisions and outcomes
Patience and consistency are key—successful market analysis takes time and practice.
8. Common Beginner Mistakes to Avoid
- Making impulsive trades based on rumors
- Ignoring risk management strategies
- Relying only on one type of analysis (fundamental or technical)
- Overtrading or checking the market excessively
- Failing to plan for long-term trends
Avoiding these mistakes improves confidence and increases the likelihood of profitable outcomes.
9. Practical Example for Beginners
Suppose a beginner wants to analyze a U.S. tech stock:
- Check the company’s earnings report and growth metrics (fundamental analysis)
- Examine its price chart for trends, support, and resistance levels (technical analysis)
- Compare performance to similar companies in the sector
- Evaluate market sentiment—what analysts and investors are saying
- Decide whether to buy, hold, or avoid based on the analysis
This step-by-step process helps beginners make logical, data-driven decisions instead of guessing.
Conclusion
Market analysis for beginners USA is an essential skill for anyone looking to invest or participate in the U.S. economy. By understanding fundamental and technical analysis, identifying market trends, using the right tools, and learning from mistakes, beginners can make informed decisions and build a solid foundation for long-term financial success.
With consistent learning and disciplined practice, market analysis becomes less intimidating and more rewarding over time.
FAQs – Market Analysis for Beginners USA
1. What is market analysis?
Market analysis is the process of studying financial markets to understand trends, evaluate investments, and make informed trading or business decisions.
2. Why is market analysis important for beginners?
It helps beginners reduce risk, identify opportunities, understand market trends, and make data-driven decisions rather than relying on guesswork.
3. What are the main types of market analysis?
The two main types are:
Fundamental Analysis: Evaluates a company’s financial health, earnings, and industry position.
Technical Analysis: Uses price charts, trends, and indicators to predict future price movements.
4. Which U.S. stock indexes should beginners follow?
Beginners should track major indexes like:
Dow Jones Industrial Average (DJIA)
S&P 500
Nasdaq Composite
These indexes provide a snapshot of overall market performance.
5. Can beginners succeed in market analysis without prior experience?
Yes. With patience, practice, and continuous learning, beginners can gradually understand market trends and make informed investment decisions.


